- Răspunsuri 19
- Citiri 8,3k
- Creat
- Ultimul Răspuns
Top autori în acest subiect
-
ciprianeagu@yahoo.com 8 postări
-
comanel 4 postări
-
oltciter 2 postări
-
denielmds 2 postări


Zile populare
Most Popular Posts
-
@ciprianeagu@yahoo.com Instalezi indicatorul pe chart dupa care: 1.Click dreapta pe chart si selectezi Proprieties sau mai simplu F8. 2.Aplici "None" pentru culorile :Bar Up, Bar Down, Bull candle,
Imagini postate
Featured Replies
Navigare recentă 0
- Nici un utilizator înregistrat nu vede această pagină.
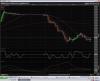
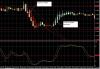
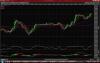
Lumanarile de tip Heikin-Ashi sunt oferite drept suport grafic la Oanda (probabil si la alti brokeri). Sunt curios daca exista cineva pe forum care le foloseste. DIn cate am observat eu pe chart, identifica foarte bine trendul. In majoritatea cazurilor, daca se formeaza cel putin 2-3 de aceeasi culoare si mai trece se de EMA 8, si mai avem si cross 8/21, deja e un trend bun!
Sunt si semnale false, dar parca-parca, pe tf 15 min, iesi pe plus...
Heikin-Ashi
The Heikin-Ashi (meaning "average bar" in Japanese) is a modified candlestick chart where the open-high-low-close (OHLC) values take the previous period into account to better isolate trends. Other than using different calculations, the chart acts and looks the same as the candlestick chart.
OHLC values are calculated from midprice values as follows:
Open: The midpoint of the current Heikin-Ashi open and close values for the previous bar.
High: The high (or the Heikin-Ashi Open if it was higher).
Low: The low (or the Heikin-Ashi Open if it was lower).
Close: The average of four bar prices: open, high, low, and close.
http://fxtrade.oanda.com/shared/documents/third_party/FXTrade_Platform_User_Guide/images/ExampleHeikenAshi,.gif
Candlestick (same period)
http://fxtrade.oanda.com/shared/documents/third_party/FXTrade_Platform_User_Guide/images/ExampleCandlestick.gif