


Tiberiu
-
Număr mesaje
294 -
Înregistrat
-
Ultima Vizită
-
Zile Câștigate
13
Tip conținut
Profiluri
Forumuri
Bloguri
Postări postat de Tiberiu
- Anterioară
- 1
- 2
- 3
- 4
- 5
- 6
- 7
- 8
- 9
- 10
- Următoarea
- Pagina 5 din 12
-
-
1000 Pips si traling stop-ul la 800 Pips este o pozitie foarte buna.
Felicitari si respect.
Ce parere ai de Gbp/Aud? Nu este atat de volatila perechea dar se coreleaza bine cu trendul de pe Gbp/Nzd
-
 1
1
-
-
Poate cineva sa-mi explice ce s-a intamplat cu eur/usd azi la ora 14?rar am vazut asa crestere. sunt incepator si incerc sa inteleg fenomenul...sper ca am postat unde trebuie.ms.
Salut,
Au aparut zvonuri pe piata in jurul orei 14 cu privire la recapitalizarea Bancilor europene de catre ECB din fondul ESM.
Atentie, si ieri au aparut astfel de zvonuri negate apoi de catre ECB.
Cred ca aceste zvonuri vor fi infirmate sau confirmate de catre presedintele ECB - Mario Draghi in decursul discursului de astazi.
Reuters - http://www.reuters.com/article/2012/05/30/us-eu-economy-eurozone-idUSBRE84T0KM20120530
Forex Factory - http://www.forexfactory.com/news.php?do=news&id=364923
Cu respect,
Tiberiu
-
1
-
-
Usdx si eurusd sunt invers corelate.Daca eurusd face un lower low atunci usdx trebuie sa faca un higher high.In caz contrar rezulta o divergenta ceea ce ne poate anunta o schimbare de trend bineinteles in confluenta cu alte elemente ale analizei noastre:key s/r level,fib retr,pivoti,COT report...
La fel si in cazul gbpusd si usdx.In poza, gbpusd face un lower low in timp ce usdx face un lower high.
In concluzie tu vezi un trend reversal pe Gbp/Usd??
-
Intr-adevar 1.247 este o zona de Demand/Cerere foarte puternica si din Iunie,Iulie si Octombrie 2006
daca ma uit mai bine pe weekly. Si mai ales dupa cum ai spus si tu din oct-nov 2008 si martie 2009.
Daca sparge 1.260 Euro are mari sanse sa faca un sell-off/waterfall de 150 pipsi pana la 1.247.
Spor la pipsi,
Tiberiu
-
1
-
-
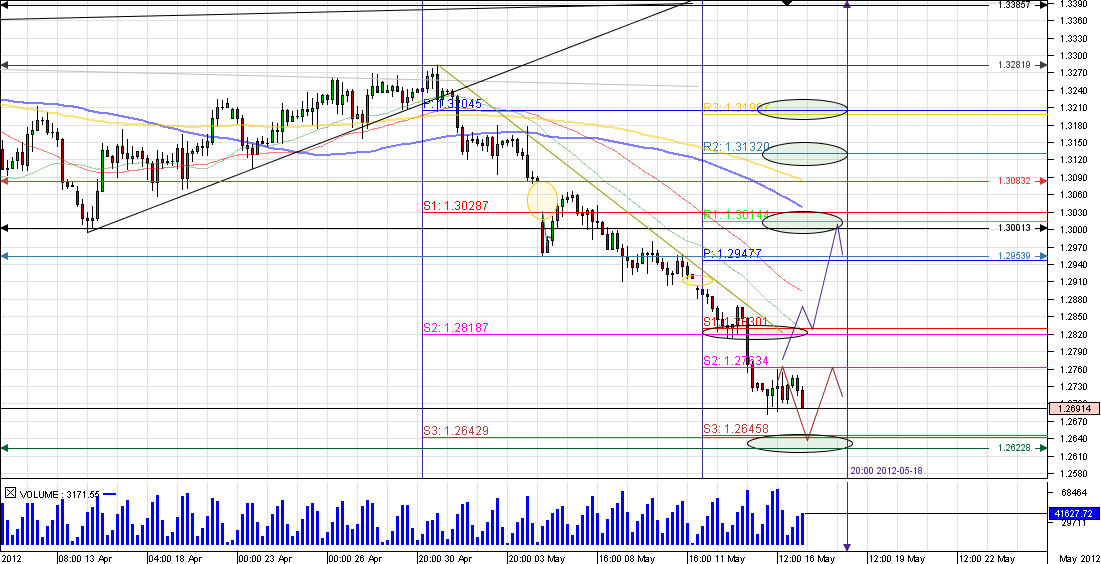
>> 5) Eur/Usd - 4 hours Chart - (17.05.2012 Update)>> Bearish
Probability Key Levels:
>>1.285 - 1.282 area -Weekly S1 Pivot and the Monthly S2 Pivot. (1st Level Key Level),
>>1.276 - Weekly S2 Pivot Point,
>>1.291 - the close from Friday and the continuation Gap from Monday opening,
>>1.295 - weekly Main Pivot and the Resistence from 6th of May, (1st
Level Key Level),
>>1.300 - 1.303 area -hystorical level and resistence from 16th of April, Monthly S1 Pivot, Weekly R1 Pivot, (2nd Level Key Level),
>>1.308 - the close for the Breakout Continuation Gap, future
confluence with the 100 SMA
>> 5) Eur/Usd - 4 hours Chart - (17.05.2012 Update)>> Bearish
Probability Key Levels:
>> Sideways Movement between>>1.276 - Weekly S2 Pivot Point
(Resistence),
>>1.262 - 1.264 area- Important Demand area confluence between the Support from 15th of January, the Monthly S3 Pivot and the Weekly S3 Pivot Point.(2nd Level Key LEvel).
We may see a breakout next week in this case.

Thank You for your support,
Doctortyby
-
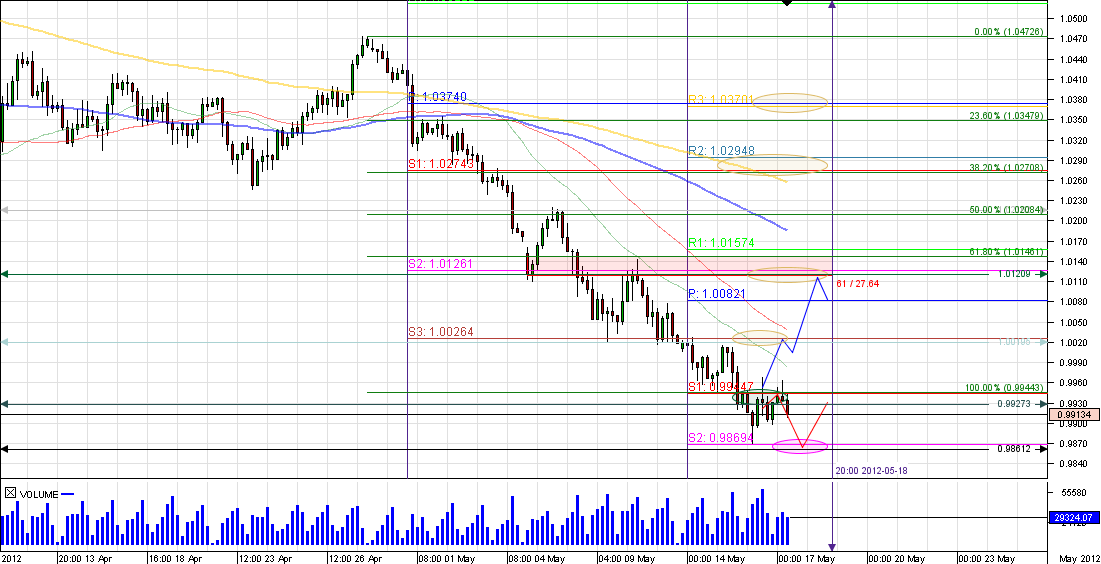
>> 4) Aud/Usd - 4 hours Chart - (17.05.2012 Update)>> - Bullish Probability Key Levels:
>>0.994 - 0.993 area -resistence from the 9th of August 2011, Weekly S1
Pivot,
>>1.002 - Psychological Level, the resistence from the 9th of May, Monthly S3 Pivot,(1st Level Key Level),
>>1.008 - Weekly Main Pivot Point,
>>1.013 - 1.016 area - resistences from the 7th and 10th of May, the Monthly S2 Pivot, the Weekly R1 Pivot, and the 61.8% Fibonacci from the
Sell-Off in May,(2nd Level Key Level)
>>1.020 - Resistence from the 8th of May, confluence with the 100 SMA,
>> 4) Aud/Usd - 4 hours Chart - (17.05.2012 Update)>> - Bearish Probability Key Levels:
>> Price has found support at 0.986 - 0.985 area (Weekly S2 Pivot and support from the 15th and 19th of December 2011) and retraced back to 0.995 (Weekly S1 Pivot).
If 0.985 will be broken and confirmed, we will see a continuation of the Minor sell-off from the 1st of may to reach first 0.973 (weekly S3 Pivot) and 0.966 (Major Support from the 25th of November).
Thank You for your support,
Doctortyby
-
1
-
-
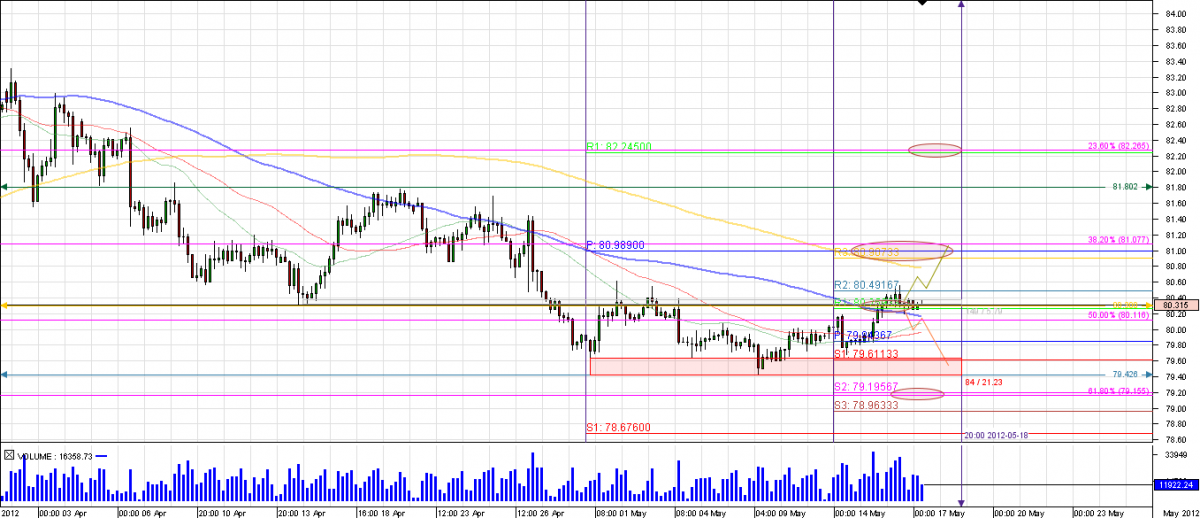
>> 3) Usd/Jpy - 4 hours Chart - (17.05.2012 Update)>> - Bullish Probability Key Levels:
>>80.49 - Weekly R2 Pivot,
>>80.90 - 81.00 area - Key confluence between the 200 SMA, Weekly R3 Pivot, Monthly Main Pivot Point, 38.2% Fibonacci Retracement from the previous Intermediate Uptrend, (2nd Level Key Level)
>>81.80 - the Resistence from the 10th and 20th of April.
>> 3) Usd/Jpy - 4 hours Chart - (17.05.2012 Update)>>- Bearish Probability Key Levels:
>>80.30 - 80.40 area -Weekly R1 Pivot and the Support from the 16th of April, and from the 2nd and 3rd of May,100 SMA (2nd Level Key Level),
>>79.61 - 79.42 area - Major Demand Area, Weekly S1 Pivot, Supports from the 1st, 6th, 9th and 14th of May, (2nd Level Key Level)
>>79.19 - 79.15 area - Weekly S2 Pivot and the 61.8% Fibonacci from the previous Intermediate Uptrend, (1st Level Key Level)
>>78.96 - Weekly S3 Pivot.
Thank You for your support,
Doctortyby
-
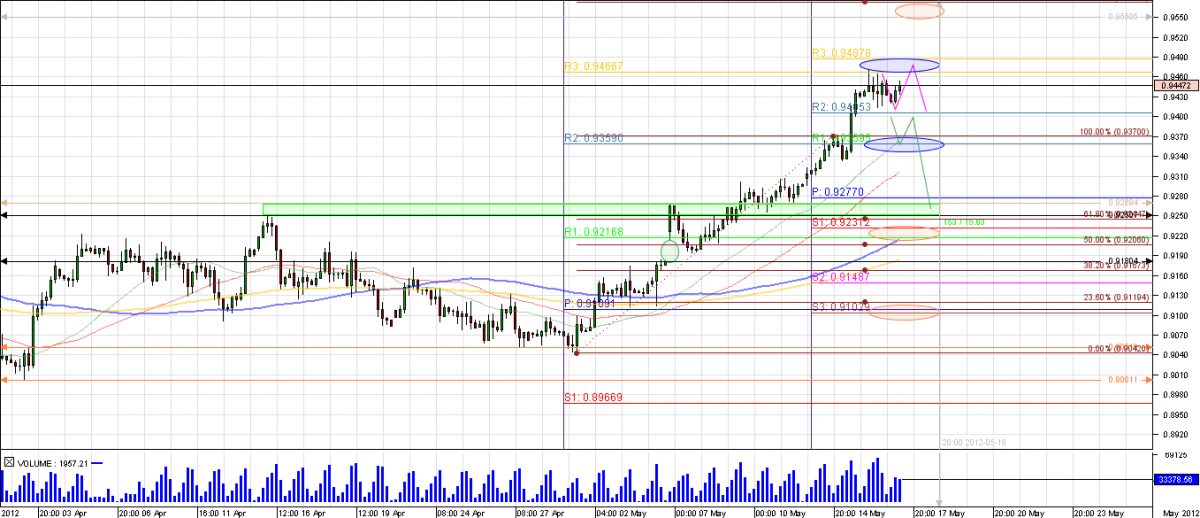
>> 2) Usd/Chf - 4 hours Chart - (17.05.2012 Update)>>- Bearish Probability Key Levels:
>>0.940 - Weekly R2 Pivot Point,
>>0.936 - Weekly R1 Pivot and the Monthly R2 Pivot, (1st Level Key Level).
>>0.927 - 0.928 - Support from the 6th of May and Weekly Main Pivot Point, (1st Level Key Level),
>>0.925 - Support from the 15th of April,
>>0.923 - 0.922 area -Monthly R1 Pivot, weekly S1 Pivot,the 100 SMA, (2nd Level Key Level),
>>0.915 - confluence between the 200 SMA and the Weekly S2 Pivot, (1st Level Key Level)>>>
>> 2) Usd/Chf - 4 hours Chart - (17.05.2012 Update)>>- Bullish Probability Key Levels:
Price has found resistence at 0.946 - 0.949 area (confluence between the Monthly R3 Pivot and the Weekly R3 Pivot).
If we will see a breakout and confirmation of this key level area price could reach 0.955 - 0.960 area (Major supply area from december 2011 and January 2012).
This would be a continuation of the minor rally from the beggining of May, without an important retracement.
Thank You for your support,
Doctortyby
-
Salutare Oltciter,
E o situatie extrem de interesanta pe trendul minor de la inceputul lui Mai.
Avem un sell-off fara un retracement important si cu doua gap-uri
Breakout de continuare in directia trendului care nu au fost inchise.
(1.308 si 1.291). Cred ca vom vedea un "sharp reversal" atunci cand va avea loc:
pe suportul de la 1.264-1.262, pe cel de la 1.215 (din 29 Iunie 2010).. sau cine
stie unde (in cazul extrem al unei recesiuni de proportii - poate chiar
1.190 - 9 Iunie 2010 sau paritate).
Ce parere ai pe termen scurt, mediu, si lung??
Toate perechile par sa se deprecieze fata de dolarul american.
Cu respect,
Tiberiu - doctortyby
-
1
-
-
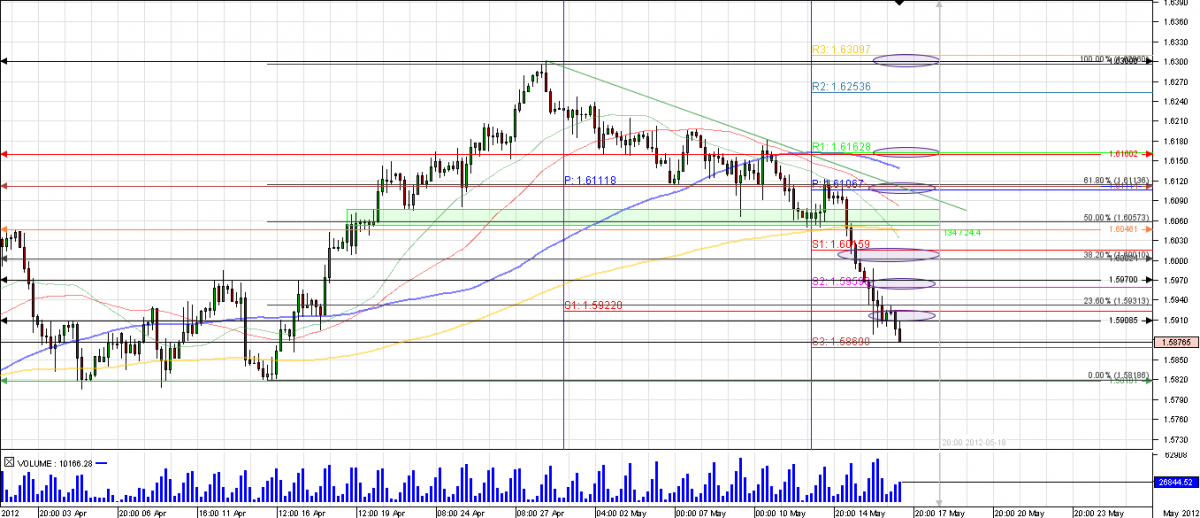
1)Gbp/Usd - 4 hours Chart - (17.05.2012 Update) - Bullish Probability Key Levels:
>>1.611 -Monthly Pivot, Weekly Pivot, the Minor Trend Trendline,61.8% Fibonacci, (2nd Level Key Level)
>>1.616 - Weekly R1 Pivot 100 SMA,resistence from 2nd of May (2nd Level Key Level),
>>1.605 -200 SMA and resistence from the 3rd of April, (1st Level Key Level),
>>1.600 -Weekly S1 Pivot, the 38.2% Fibonacci and the hystorical level, (2nd Level Key Level),
>>1.597 -Weekly S2 Pivot and the resistence from the 13th of April and 27th of March (2nd Level Key Level),
>>1.592 - Monthly S1 Pivot and resistence from March,>>
1)Gbp/Usd - 4 hours Chart - (17.05.2012) - Bearish Probability Key Levels:
Price has broken 1.592 - 1.591 area (Monthly S1 Pivot and support from 19th,21st of March, 5th, 10th, 16th and 19th of April).
If the breakout will be confirmed we will see the minor sell-off continuation to reach first 1.587 - Weekly S3 Pivot, and finally 1.582 (support from March and 5th, 10th and 12th of April).
Thank You for your support
Doctortyby
-
>> 5) Eur/Usd - 4 hours Chart - (15.05.2012)
Market Conditions:
- Major Downtrend from May 2011,
- Intermediate Downtrend from March 2012,
- Minor Downtrend from 1st of May 2012, 470 Pips Sell-Off
- Increasing Bearish Volume,
- 2 Breakout Continuation Gaps (1.308, 1.291)
- 1.291 - the close from Friday and the continuation Gap from Monday opening,
- 1.295 - weekly Main Pivot Point and the Resistence from 6th of May, (1st Level Key Level),
- 1.300 - 1.303 area - confluence between the hystorical level and support from 16th of April and the Monthly S1 Pivot and the Weekly R1 Pivot, (2nd Level Key Level),
- 1.308 - the close from 4th of May which formed a Breakout Continuation Gap maybe future confluence with the 100 SMA,
- 1.313 - confluence between the Weekly R2 Pivot Point and the 200 SMA, (1st Level Key Level),
- 1.318 - 1.320 area - Important confluence between the Monthly Main Pivot, the Weekly R3 1Pivot Point and the Intermediate Downtrend Trendline, (2nd Level Key Level),
- 1.285 - 1.282 area - confluence between the Weekly S1 Pivot and the Monthly S2 Pivot. (1st Level Key Level),
- 1.276 - Weekly S2 Pivot Point,
- 1.262 - 1.264 area - Important Demand area confluence between the Support from 15th of January, the Monthly S3 Pivot and the Weekly S3 Pivot Point.
Bullish and Bearish Clear Probabilities:http://www.dukascopy.com/imageserver/img/91065fb0d8933bf8251515219ea0fc8f/500_2/image495.jpg
Mixed Probabilities:
http://www.dukascopy.com/imageserver/img/fe616bd6916563281aa2001294c37aa0/500_2/image73.jpg http://www.dukascopy.com/imageserver/img/c6f4dbac57069cc007c693ca9054f65e/500_2/image969.jpg
Multumesc pentru support,
Doctortyby
-
1
-
>> 4) Aud/Usd - 4 hours Chart - (15.05.2012)
Market Conditions:
- Major Uptrend from February 2009 - Sideways Movement from May 2011,
- Intermediate Downtrend from February 2012,
- Minor Downtrend from 30th of April 2012, 525 Pips Sell-Off
- Increasing Bearish Volume,
- 1.002 - Psychological Level, the resistence from the 9th of May, Monthly S3 Pivot Point resistence, (1st Level Key Level)
- 1.008 - Weekly Main Pivot Point,
- 1.013 - 1.016 area - Major Supply Area, Key confluence between the resistences from the 7th and 10th of May, the Monthly S2 Pivot, the Weekly R1 Pivot, and the 61.8% Fibonacci Retracement from the Sell-Off in May, (2nd Level Key Level)
- 1.020 - Resistence from the 8th of May, confluence with the 100 SMA,
- 1.027 - 1.029 area - confluence between the 200 SMA, the 38.2% Fibonacci Retracement from the Sell-Off in May, and the Weekly R2 Pivot Point, (2nd Level Key Level)
- 1.037 - confluence between the Monthly Main Pivot and the Weekly R3 Pivot, (1st Level Key Level)
- 0.994 - 0.993 area - confluence between the support from the 9th of August 2011 and the Weekly S1 Pivot,
- 0.987 - support from the 15th December 2011, and Weekly S2 Pivot.
Bullish and Bearish Clear Probabilities:
http://www.dukascopy.com/imageserver/img/6229b3f1f2280a29b74abe7f174d357d/500_2/image16.jpg
Mixed Probabilities:
http://www.dukascopy.com/imageserver/img/4132d70968871800261f960ebc6beb24/500_2/image278.jpg
http://www.dukascopy.com/imageserver/img/ae1814a89fd15e432189a6c9704cb7b0/500_2/image655.jpg
Multumesc pentru support,
To your success,
Doctortyby
-
1
-
>> 3) Usd/Jpy - 4 hours Chart - (15.05.2012)
Market Conditions:
- Major Downtrend from 2007,
- Intermediate Downtrend from 20th of March 2012,
- Minor Sideways Movement from 1st of May 2012,
- Increasing Bearish Volume.
- 80.30 - 80.40 area - confluence between the Weekly R1 Pivot and the Resistence from the 16th of April, and from the 2nd and 3rd of May, confluence with the 100 SMA (2nd Level Key Level),
- 80.49 - Weekly R2 Pivot,
- 80.90 - 81.00 area - Key confluence between the 200 SMA, Weekly R3 Pivot, Monthly Main Pivot Point, 38.2% Fibonacci Retracement from the previous Intermediate Uptrend, (2nd Level Key Level)
- 81.80 - the Resistence from the 10th and 20th of April.
- 79.61 - 79.42 area - Major Demand Area, Weekly S1 Pivot, Supports from the 1st, 6th, 9th and 14th of May, (2nd Level Key Level)
- 79.19 - 79.15 area - confluence between the Weekly S2 Pivot and the 61.8% Fibonacci Retracement from the previous Intermediate Uptrend, (1st Level Key Level)
- 78.96 - Weekly S3 Pivot.
Bullish and Bearish Clear Probabilities:
http://www.dukascopy.com/imageserver/img/25fa06d96eeda27974917f72d54639a0/500_2/image653.jpg
Mixed Probabilities:
http://www.dukascopy.com/imageserver/img/9d7030f6ce019651b25006eb38884eb7/500_2/image608.jpg
http://www.dukascopy.com/imageserver/img/f05d46afdf4e05365c097e487d50ed3d/500_2/image816.jpg
Thank You for your support,
Doctortyby
-
1
-
>> 2) Usd/Chf - 4 hours Chart - (15.05.2012)
Market Conditions:
- Major Uptrend from August 2011,
- Sideways Movement from December 2011 (between 0.955 - 0.892),
- Minor Uptrend from 1st of May 2012, 330 Pips Rally,
- Increasing Bullish Volume,
- Breakout Continuation Gap - 0.918
- 0.936 - Important confluence between the Weekly R1 Pivot and the Monthly R2 Pivot, (1st Level Key Level).
- 0.940 - Weekly R2 Pivot Point,
- 0.947 - 0.949 area - confluence between the Monthly R3 Pivot and the Weekly R3 Pivot, (1st Level Key Level)
- 0.927 - 0.928 - Resistence from the 6th of May and Weekly Main Pivot Point, (1st Level Key Level),
- 0.925 - Support from the 15th of April,
- 0.923 - 0.922 area - confluence between the Monthly R1 Pivot Support and the weekly S1 Pivot, also future confluence with the 100 SMA, (2nd Level Key Level),
- 0.915 - confluence between the 200 SMA and the Weekly S2 Pivot, (1st Level Key Level)
- 0.910 - confluence between the Monthly Main Pivot Point and the Weekly S3 Pivot, (1st Level Key Level).
Bullish and Bearish Clear Probabilities:
http://www.dukascopy.com/imageserver/img/8c437fb71bad80a18140b13ce1244d6b/500_2/image373.jpg
Mixed Probabilities:
http://www.dukascopy.com/imageserver/img/55c415fc6417c9c58bdd82a7a2802973/500_2/image749.jpg
http://www.dukascopy.com/imageserver/img/b9fcb99c3ee8664d1ed96063b9d73450/500_2/image500.jpg
To Your Success,
Thank You for Your support,
Doctortyby
-
>> 1) Gbp/Usd - 4 hours Chart - (15.05.2012)
Market Conditions:
- Sideways Movement from September 2010 (Between 1.525 - 1.675),
- Intermediate Uptrend from January 2012,
- Minor Downtrend from 1st of May 2012, 250 Pips Sell-Off
- Increasing Bearish Volume,
- 1.611 - confluence between the Monthly Main Pivot, Weekly Main Pivot, the Minor Trend Trendline, the 61.8% Fibonacci Retracement, (2nd Level Key Level)
- 1.616 - confluence between the Weekly R1 Pivot and the 100 SMA, also resistence fro 2nd of May (2nd Level Key Level),
- 1.625 - Weekly R2 Pivot,
- 1.630 - hystorical level, confluence with the Weekly R3 Pivot Point and resistence from the 30th of April,(2nd Level Key Level),
- 1.605 - confluence between the 200 SMA and the Support from the 3rd of April, (1st Level Key Level)
- 1.600 - confluence between the Weekly S1 Pivot, the 38.2% Fibonacci Retracement and the hystorical level, (2nd Level Key Level),
- 1.597 - Important confluence between the Weekly S2 Pivot and the support from the 13th of April and 27th of March, (2nd Level Key Level),
- 1.592 - Monthly S1 Pivot and a support from March,
- 1.587 - Weekly S3 Pivot.
Bullish and Bearish Clear Probabilities:
http://www.dukascopy.com/imageserver/img/2dacd23207672270ddcc309aaa028667/500_2/image798.jpg
Mixed Probabilities:
http://www.dukascopy.com/imageserver/img/aed29e55c53aa4b7cebf0d5d3076719a/500_2/image502.jpg
http://www.dukascopy.com/imageserver/img/666aa6498adb53ee7523c938589bb056/500_2/image187.jpg
To Your Success,
Multumesc pentru suport,
Doctortyby
-
4). - a) Usd/Jpy - 4 Hours Chart (09.05.2012) - Bullish Probability Key Levels:
- 80,00 - 80.12 area - Important confluence between the Weekly Main Pivot, the Hystorical level, 50% Fibonacci Retracement from the Daily Chart, and the cross between the 30 and 50 SMAs, (2nd Level Key Levels),
- 80.30 - 80.40 area - confluence between the Weekly R1 Pivot and the Resistence from the 16th of April, maybe even a future confluence with the 100 SMA (2nd Level Key Level),
- 80.99 - 81.00 area - Important confluence between the Monthly Main Pivot, the Weekly R2 Pivot, future confluence with the 200 SMA, and 38.2% Fibonacci Retracement from the Daily Chart, also a resistence from the 13th of April,(2nd Level Key Level)
- 81.38 - Weekly R3 Pivot,
- 82.25 - confluence between the Monthly R1 Pivot and the 23.6% Fibonacci from the Daily chart,(1st Level Key Level)
- 79.70 - Supports from the 1st and 6th of May, (1st Level Key Level)
- 79.43 - Weekly S1 Pivot,
- 79.15 - 79.05 area - confluence between the Weekly S2 Pivot, and the 61.8% Fibonacci Retracement from the Daily Chart, (1st Level Key Level)
- 78.68 - 78.46 area - confluence between the Weekly S3 Pivot and the Monthly S1 Pivot, (1st Level Key Level)
- Bullish and Bearish Probabilities:
- Mixed Probablities:
http://www.dukascopy.com/imageserver/img/fca0de3a4adfa4f9d1567e8072bcb6fa/500_2/image625.jpg
Multumesc pentru suport,
Fir intins la pipsi,
Doctortyby
-
1
-
3). - a) Usd/Chf - 4 Hours Chart (09.05.2012) - Bullish Probability Key Levels:
- 0.919 - 0.921 area - confluence between the Weekly Main Pivot, the Monthly R1 Pivot, and the Resistences from the 6th, 9th and 10th of April, (2nd Level Key Level),
- 0.925 - Resistence from the 16th of April,
- 0.927 - Resistence from Sunday,
- 0.934 - 0.936 area - Important confluence between the Weekly R1 Pivot and the Monthly R2 Pivot, (1st Level Key Level).
- 0.918 - Friday close, and the close of the Gap from Sunday opening,
- 0.911 - Important confluence between the Monthly Main Pivot, the Weekly S1 Pivot, the cross between the 100 and 200 SMAs, and the Support from April 12, (2nd Level Key Level)
- 0.905 - Support from the 1st of May,
- 0.900 - Hystorical level and the Support from the 3rd of April, (1st Level Key Level)
- 0.896 - Confluence between the Monthly S1 Pivot and the Weekly S2 Pivot, (1st Level Key Level).
- Bullish and Bearish Probabilities:
- Mixed Probabilities:
http://www.dukascopy.com/imageserver/img/a1f428b1fc46c307a5b010bc971dd6f7/500_2/image977.jpg
Multumesc pentru suport,
Doctortyby
-
1
-
2). - a) Gbp/Usd - 4 Hours Chart (09.05.2012) - Bullish Probability Key Levels:
- 1.618 - confluence between the Weekly main Pivot and the 30 and 50 SMAs, (2nd Level Key Level),
- 1.624 - confluence between the Weekly R1 Pivot and the Resistence from the 1st and 2nd of May, (1st Level Key Level),
- 1.630 - hystorical level and resistence from the 30th of April,
- 1.636 - Weekly R2 Pivot.
- 1.611 - confluence between the Monthly main Pivot and the 100 SMA, (1st Level Key Level)
- 1.605 - confluence between the Weekly S1 Pivot and the support from the 3rd of April, (1st Level Key Level),
- 1.597 - 1.600 area - Important confluence between the Weekly S2 Pivot, the 200 SMA, the hystorical level and the support from the 13th of April and 27th of March, (2nd Level Key Level),
- 1.592 - Monthly S1 Pivot,
- 1.587 - Weekly S3 Pivot,
- 1.582 - Supports from the 5th, 10th and 16th of April. (2nd Level Key Level).
- Bullish and Bearish Probabilities:
- Mixed Probabilities:
http://www.dukascopy.com/imageserver/img/c1e008b0f8bab772b1c7e3cf13b5112d/500_2/image285.jpg
Multumesc pentru suport,
Doctortyby
-
1). - a) Eur/Usd - 4 Hours Chart (09.05.2012) - Bullish Probability Key Levels:
- 1.300 - 1.303 area - confluence between the hystorical level and support from 16th of April and the Monthly S1 Pivot, (2nd Level Key Level),
- 1.307 - 1.308 area - confluence between the main Weekly Pivot and the Friday close which formed a Gap on Sunday, (1st Level Key Level),
- 1.318 - 1.320 area - Important confluence between the Monthly Main Pivot, the Weekly R1 Pivot and the 200 SMA, (2nd Level Key Level),
- 1.325 - dynamic resistence from the Downtrend line,
- 1.339 - 1.341 - Important resistence, confluence between the Monthly R1 Pivot, the Weekly R2 Pivot, the two dynamic resistences from the secondary Uptrend lines, and the Resistence from 3rd of April, (2nd Level Key Level).
- 1.295 - Last Support from Sunday,
- 1.285 - 1.282 area - confluence between the Weekly S1 Pivot and the Monthly S2 Pivot.
- Bullish and Bearish Probabilities:
- Mixed Probabilities:
http://www.dukascopy.com/imageserver/img/b01544c15eb570db2046208b2eea9c8f/500_2/image839.jpg
Multumesc pentru suport,
Doctortyby
-
4) Gbp/Usd - 4 Hours chart (02.05.2012) - Weeklly view,
a) - Bullish probability - Key Levels to watch:
- 1.621 - the Weekly Main Pivot (simple Key Level),
- 1.630 - the last Resistence (simple Key Level),
- 1.634 - the Weekly R1 Pivot (simple Key Level),
- 1.642 - confluence between the Weekly R2 Pivot and the Monthly R1 Pivot (1st level Key Level).
b) - Bearish probability - Key Levels to watch:
- 1.614 - 1.611 - confluence between the Weekly S1 Pivot, the Monthly Main Pivot and the 61.8% Fibonacci Retracement from the last swing up (2nd level Key Level),
- 1.606 - confluence between the 50% Fibonacci Retracement, the Support from the 30th of March, and the 100 SMA (2nd level Key Level),
- 1.600 - Key confluence between the historical support, the Weekly S2 Pivot, the 38.2% Fibonacci Retracement, and the 200 SMA (2d level Key Level),
- 1.594 - 1.593 area - confluence between the Monthly S1 Pivot and the Weekly S3 Pivot (1st level Key Level).
Bullish and Bearish Probabilities - Gbp/Usd - 4 Hours Chart :
http://www.dukascopy.com/imageserver/img/3f1521c5f0ea2adb3808ad22cc765dc2/500_2/image944.jpg
To your success,
Thank you for your support,
Doctortyby
-
1
-
-
3) Gbp/Usd - Daily chart (02.05.2012) - Monthly view,
a) - Bullish probability - Key Levels to watch:
- 1.611 - 1.616 area - the Monthly Main Pivot, confluence with the Support from October and November 2011 (1st Level Key Level),
- 1.641 - Monthly R1 Pivot (simple Key Level),
- 1.660 - Monthly R2 Pivot (simple Key Level).
b) - Bearish probability - Key Levels to watch:
- 1.592 - 1.589 area - Key confluence between the Monthly S1 Pivot, the 61.8% Fibonacci Retracement from the last swing up, and the support from February (2nd level Key Level),
- 1.577 - confluence between the 50% Fibonacci Retracement and the 100 and 200 DMAs crossover (1st level Key Level),
- 1.564 - 1.562 area - Key confluence between the Monthly S2 Pivot and the 38.2% Fibonacci Retracement, and the Supports from February and March (2nd level Key Level),
- 1.542 - confluence between the Monthly S3 Pivot and the Supports from November and December 2011 (2nd level Key Level).
Probability Charts:
Bullish and Bearish Probabilities - Gbp/Usd - Daily Chart :
http://www.dukascopy.com/imageserver/img/c90066edd18d74cf2999c217f9992839/500_2/image385.jpg
Mixed Probabilities - Gbp/Usd - Daily Chart :
http://www.dukascopy.com/imageserver/img/81bd65eed26c654dadfce116d5dd4de6/500_2/image555.jpg
http://www.dukascopy.com/imageserver/img/c49c9f3ca7ee94501ef331862376a68a/500_2/image760.jpg
To your success,
Doctortyby
-
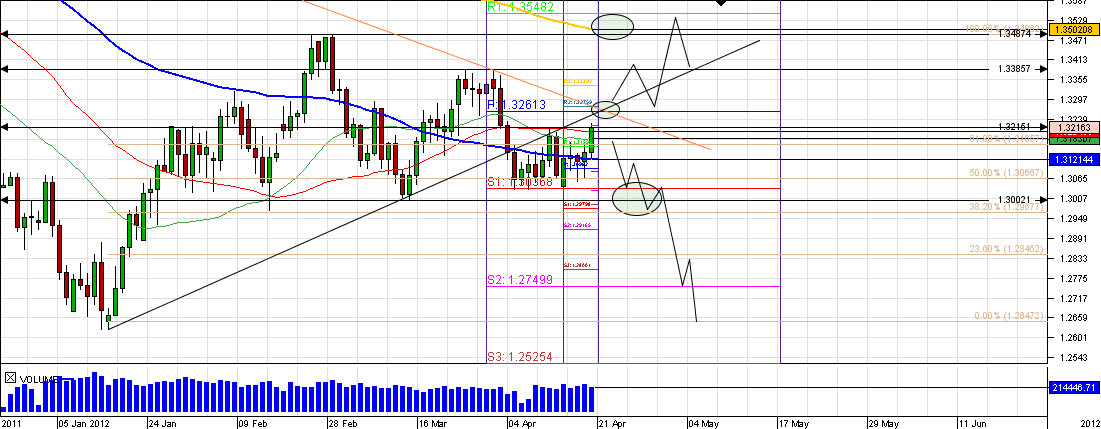
2) Eur/Usd - 4 Hours Chart (02.05.2012), Weekly view,
a) - Bullish probability - Key Levels to watch:
- 1.320 - Key confluence between the Monthly Main Pivot, the Weekly Main Pivot, and the 200 SMA on the 4 Hours chart (2nd level Key Level),
- 1.323 - 38.2 % Fibonacci Retracement from the last swing up on the 4 hours chart (simple Key Level),
- 1.329 - 1.330 area - confluence between the Weekly R1 Pivot, the 23.6% fibonacci Retracement and the Main Downtrend line and secondary Uptrend line cross (2nd level Key Level),
- 1.337 - 1.338 area - Key confluence between the Weekly R2 Pivot and the Resistence from the beginning of April (1st level Key Level),
- 1.347 - Weekly R3 Pivot (simple Key Level).
b) - Bearish probability - Key Levels to watch:
- 1.314 - Key confluence between the Weekly S1 Pivot and the 61.8% Fibonacci Retracement from the last swing up (1st level Key Level),
- 1.304 - 1.303 area - confluence between the Weekly S2 Pivot and the Monthly S1 Pivot (1st level Key Level),
- 1.300 - 1.297 area - confluence between the historical level, the Support from the 16th of April (2nd level Key Level).
Bullish and Bearish Probabilities - Eur/Usd - 4 Hours Chart :
http://www.dukascopy.com/imageserver/img/b0f75535d7f98d7ad5435509108f2139/500_2/image215.jpg
To your success,
Doctortyby
-
1) Eur/Usd - Daily Chart (02.05.2012) - Monthly view,
a) - Bullish probability - Key Levels to watch:
- 1.316 - 1.320 area - confluence between the Main Monthly Pivot, Main Downtrend line and 38.2% Fibonacci Retracement (2nd level Key Area),
- 1.328 - confluence between the 200 DMA and 23.6% Fibonacci Retracement (1st level Key Level),
- 1.341 - confluence between the Monthly R1 Pivot, resistence from the 1st of April and the Secondary Uptrend line (2nd level Key Level),
- 1.349 - Resistence from the 1st of March (simple Key Level),
- 1.359 - Monthly R2 Pivot (simple Key Level).
b) - Bearish probability - Key Levels to watch:
- 1.303 - 1.306 area - confluence between the Monthly S1 Pivot, the supports from the 15th of March and 16th of April, and 50% Fibonacci Retracement (2nd level Key Area),
- 1.295 - 61.8% Fibonacci Retracement, confluence with the support from the 16th of February (1st level Key Level),
- 1.282 - Monthly S2 Pivot (simple Key Level),
- 1.264 - 1.262 area - confluence between the Monthly S3 Pivot and the support from the 15th of January (1st level Key Level).
Probability Charts:
Bullish and Bearish Probabilities - Eur/Usd - Daily Chart :
http://www.dukascopy.com/imageserver/img/0ed780da68d6d19eed2188cd89d3a16e/500_2/image402.jpg
Mixed Probabilities - Eur/Usd - Daily Chart :
http://www.dukascopy.com/imageserver/img/da3e56ec086306e73b0ea4e06f59898b/500_2/image595.jpg
http://www.dukascopy.com/imageserver/img/a1d3cf546927bd0416e4deaf3955f82d/500_2/image815.jpg
To your success,
Doctortyby
-
1
-
-
1)Eur/Usd-Daily chart (23.04 Update)-
Bullish probability - KEY LEVELS to watch
>> 1.321 (1st level Key-Level, the last Resistence, confluence with the 50 DMA)<<,
>> 1.326 (2nd level Key-Level, confluence between the Main Monthly Pivot and the Main Downtrend dynamic Resistence Trendline, and Secondary Uptrend dynamic Trendline/ now Resistence)<<,
>> 1.340 (next resistence)<<,
>> 1.350 (2nd Level Key Level, confluence between the Monthly R1 Pivot, the 200 DMA dynamic resistence and the Resistence from February)<<,
>> 1.377 (Monthly R2 Pivot)<<
Bearish probability - KEY LEVELS to watch
>> 1.316 (1st level Key-Level, confluence between the 61.8% Fibonacci retracement and the 30 DMA support)<<,
>> 1.312 (100 DMA)<<,
>> 1.306-1.304 area (2nd level Key Area, confluence between the Monthly S1 Pivot, 50% Fibonacci Retracement and the Support of the congestion area from the last 2 weeks)<<,
>> 1.300-1.297 (2nd level Key-Level, Hystorical level, support from 15th of March and 16th of February, and the 38.2 Fibonacci Retracement)<<,
>> 1.275-1.270 (Monthly S2 Pivot and the support from 16th of January)<<
To Your success,
Doctortyby
- Anterioară
- 1
- 2
- 3
- 4
- 5
- 6
- 7
- 8
- 9
- 10
- Următoarea
- Pagina 5 din 12
Order Flow Book Analysis - Webminarii si Articole
în Strategii si planuri de tranzactionare
Postat · Editat de Tiberiu
Daily OUTLOOK for Majors and Precious Metals (ORDER FLOW BOOK) LIVE WEBMINAR - 13 - 14 (Ora Romaniei)
http://www.dukascopy...pic/show&id=476
Full Analysis for the following instruments:
- Majors : EUR/USD, GBP/USD, USD/JPY, USD/CHF, AUD/USD, NZD/USD,
- Crosses : EUR/GBP, EUR/JPY, GBP/JPY.
- Precious Metals : GOLD (XAU/USD) and SILVER (XAG/USD).
The Analysis will contain 3 Parts:
I) FUNDAMENTAL OUTLOOK - Market Movers.
II) TECHNICAL OUTLOOK :
- 1 Hour Charts,
- Correlated Range Bars Charts,
- Daily Pivots,
- Weekly Pivots,
- 50 and 200 EMAs,
- Tredlines and Channels,
- Volume Analysis.
III) ORDER FLOW BOOK ANALYSIS (the most important part) - Confirmation for the Technical Levels and Key Levels to watch during News Events.
- SWFX Sentiment Index,
- Order Flow Book (Limit and Stop Orders),
- Market Talk and Major Banks views and Comments.
To your success,
Doctortyby
Weekly OUTLOOK for Majors and Precious Metals (Order Flow Book) Live WEBMINAR - 12 - 13 (Ora Romaniei)
http://www.dukascopy...pic/show&id=474
Full Analysis for the following instruments:
- Majors : EUR/USD, GBP/USD, USD/JPY, USD/CHF, AUD/USD, NZD/USD,
- Crosses : EUR/GBP, EUR/JPY, GBP/JPY.
- Precious Metals : GOLD (XAU/USD) and SILVER (XAG/USD).
The Analysis will contain 3 Parts:
I) FUNDAMENTAL OUTLOOK - Market Movers:
- Q3 Earnings season (2nd week),
- EU Events - Summit,
- French Bonds Auction,
- Spanish Bond Auction,
- UK Events : BOE Meeting Minutes,
- US Retail Sales,
- CNY and AUD DATA.
II) TECHNICAL OUTLOOK :
- 4 Hours Charts,
- Correlated Range Bars Charts,
- Monthly Pivots,
- Weekly Pivots,
- 50 and 200 EMAs,
- Tredlines and Channels,
- Volume Analysis.
III) ORDER FLOW BOOK ANALYSIS.
- COT Report (CTFC),
- SWFX Sentiment Index,
- Order Flow Book (Limit and Stop Orders),
- Market Talk and Major Banks views and Comments.
To your success,
Doctortyby