Technical Analysis - Major Pairs (EUR/USD, AUD/USD. GBP/USD, NZD/USD, USD/CHF, USD/JPY, USD/CAD) and more...
- Răspunsuri 111
- Citiri 36,3k
- Creat
- Ultimul Răspuns


Zile populare
Most Popular Posts
-
Hai ca am inteles smecheria. Daca dam click pe link-ul din semnatura, si apoi citim unul din articolele tale de acolo, castigi puncte in concursul Dukascopy de articole. Dar ai observat ca pt a prim
-
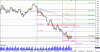
USD/CAD ar putea sa scada pe motive fundamentale: US a pus embargo la petrolul Iranian => supply mai mic => oil price up. Canada este un exportator major pt crude oil => CAD este mai cumparat
-
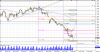
GBP/USD,Daily View,1Hour chart(16.02),c 19:00 Bullish Probability;price has found support at 1.568(Weekly s1 Pivot)today and now has reached 1.576(daily r2 Pivot)and it is testing 1.578(the Weekly
Imagini postate
Featured Replies
Navigare recentă 0
- Nici un utilizator înregistrat nu vede această pagină.
My Technical Analysis is based mainly on:
- Dialy Pivot Points, Supports and Resistences,
- Weekly Pivot Points, Supports and Resistences,
- Monthly Pivot Points, Supports and Resistences,
- Fibonacci Retracements,
- Trendlines,
- Channels,
- Crosses between Simple Moving Averages on 4H, 1H, and daily charts( 30,50,100 and 200 SMA) - for trading signals,
- candlestick formations - trading signals,
- crosses between 5 and 13 Exponential Moving Averages on 1H, 4H and daily charts - trading signals.
- I also use indicators like RSI and Volume, just for confirmation of the trading signals.
This is just a Step that you have to take to discipline yourself as a trader, have a trading plan and Make a successful trade.
Read My >>>12 Solutions to Emotional Trading Problem, 12 Steps to Make a Trade<<<
To Your success,
Doctortyby