


flames
-
Număr mesaje
344 -
Înregistrat
-
Ultima Vizită
-
Zile Câștigate
21
Tip conținut
Profiluri
Forumuri
Bloguri
Postări postat de flames
- Anterioară
- 1
- 2
- 3
- 4
- 5
- 6
- 7
- 8
- 9
- Următoarea
- Pagina 4 din 16
-
-
http://www.ziuanews.ro/dezvaluiri-investigatii/dolarul-chinezesc-82740
 ) marirea si decaderea imperiului american- )
-
@zen daca vrei sa inveti teoria clasica te pot ajuta cu materiale, macar inveti de unde trebuie .....
-
 1
1
-
-
http://www.ew-forecast.com/?aid=448 greseli peste greseli peste greseli si el e cotat destul de bine in lumea traderilor mici .
-
1
-
-
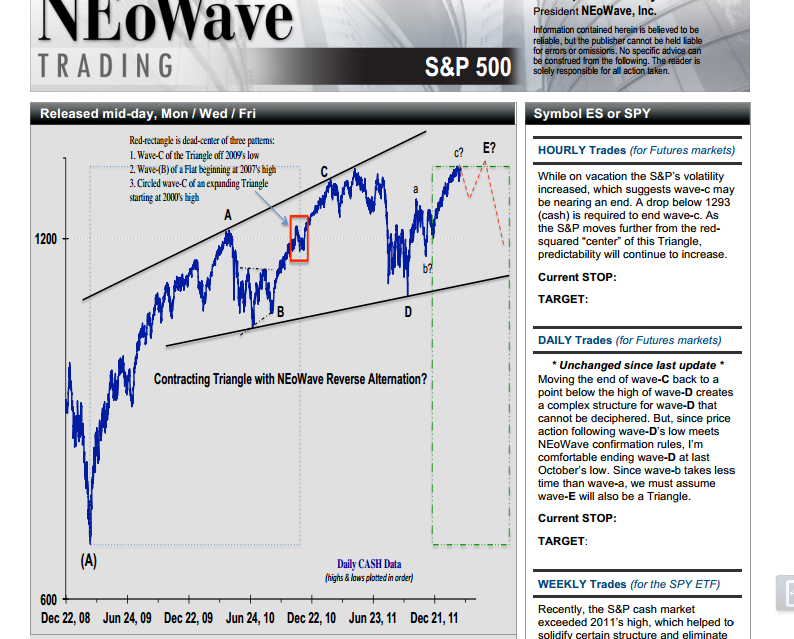
How did you know in 2007-2008 that a 4-year bear market was starting? Also, why did you extend the bear market from 4 to 6 years?
Answer:
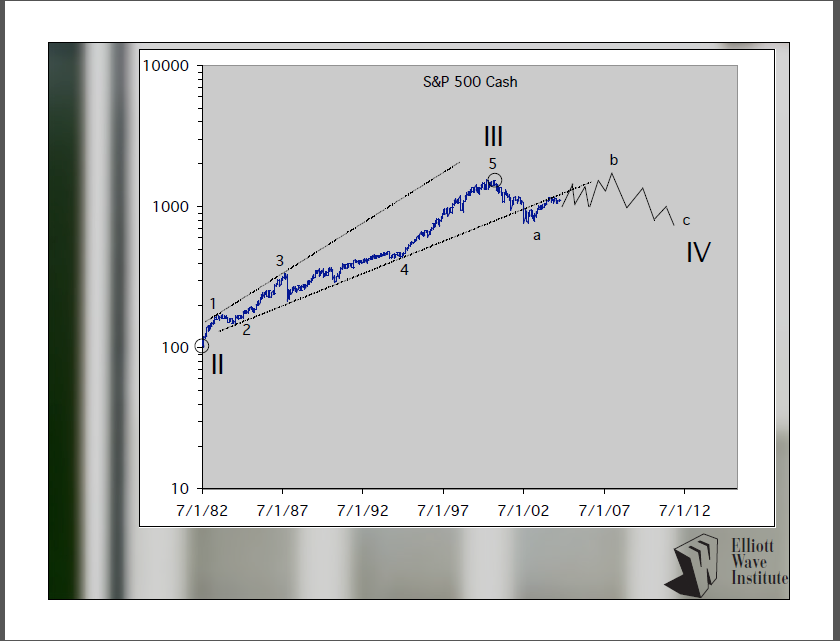
The size and speed of the 2000-2002 stock market decline made it clear a "larger degree" correction had begun. That correction had to exceed the time of the prior bull market, which was from 1982 to 2000 (i.e., the correction staring in 2000 needed to last more than 18 years). As a result, by late 2000, I knew the S&P had begun a 20 (maybe 30) year correction!
Inside of that 20-30 correction, Wave-A bottomed late 2002; wave-B topped late 2007 (wave-B ended January 2008). After obtaining that information, projecting the ideal time for C-wave was easy. All I needed to do was apply the NEoWave TIME rules found in Chapter 9 of Mastering Elliott Wave (MEW). There I wrote, IF wave-B takes much more time than wave-A, the time of wave-C will equal half the total time of waves-A+B. In this instance, Wave-A took about 2.5 years; wave-B took about 5.5 years. Their combined times (8 years) divided by 2 yielded 4 years. So, that is how I initially knew (in mid January 2008) that wave-C would take at least 4 years.
Addressing your second question, what recent event forced me to extend the required time of this bear market? The shape of the correction, which started January 2008, is that of a Flat. Wave-b of that Flat takes far more time than wave-a; so, the time of wave-c will follow the same rules mentioned above (i.e., it will be about half of a+b). Small wave-a consumed about 1.25 years, and small b-wave took nearly 3 years. Adding the time of those two patterns and dividing by 2 yields 2+ years as the ideal time projection for wave-c. When applied to a recent chart, we can comfortably assume wave-c will end in early 2014.
-
1
-
-
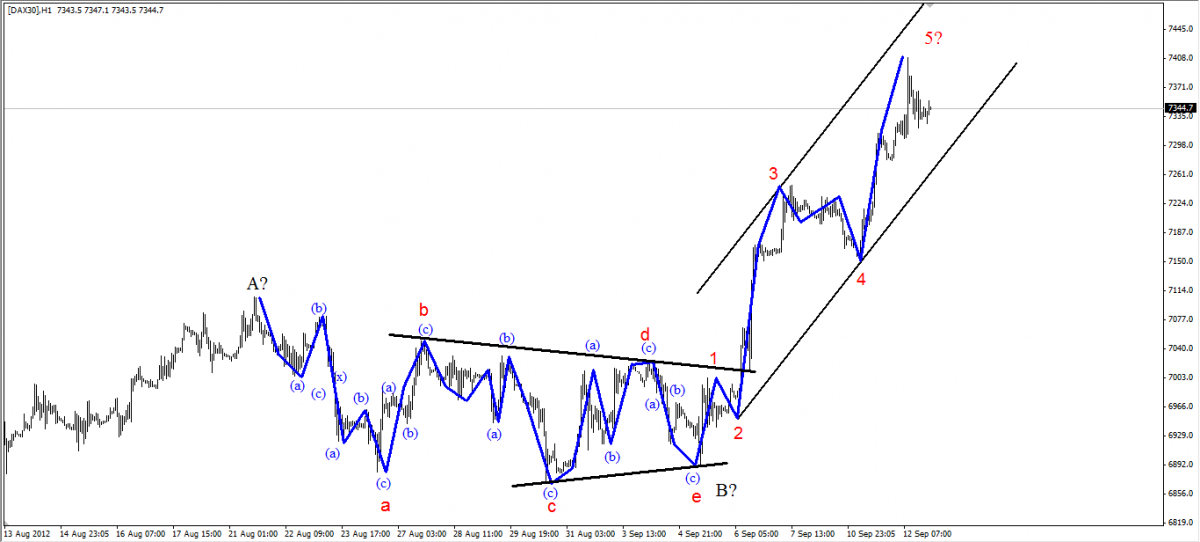
@sp&500 patternul e cel mai probabil un triungi expandabil.
Triunghiurile expandabile
Dintre toate patternurile Elliott, Triunghiul Expandabil creaza cel mai tradator mediu de tranzactionare. Aceste pattern creaza iluzia ca marketul evolueaza intr-o directie. Diagnosticul acestui pattern poate fi cauza unei panici financiare. Din nefericire nu exista cale de anticipare a formarii unui asemenea pattern.
1. Valul a ori b vor fi cele mai mici segmente din triunghi
2. Valul e are tendinta de explozie, fiind cel mai mare val in pret si timp decat oricare alt val
3. In acelasi fel, triunghiul contractive poate aparea in valul e al unui triunghi mai mare de grad superior, in triunghiul expansiv poate aparea in valul e al unui triunghi expansiv de grad superior
4. Urmareste progresia de la simplu la complex
5. Patternul dupa triunghi (val c ori 5) nu ar trebui sa sa retraga complet peste valul e
6. Unul din aspectele ciudate ale triunghiului de expansiune pare a fi lipsa a numeroase relatii Fibonacci tipic pentru triunghiului de contractie. In general numai o relatie poate fi gasita. valul a si e se vor raporta la relatia Fibonacci de 161%.
7. Triunghiul de expansiune nu poate avea loc inainte de un pattern puternic cum ar fi 1,3,5 ori dupa un c alungit. Nu poate termina corectii de tipul: dublu si triplu zigzag ori combinatii running trei. De asemenea nu poate fi valul b al unui zigzag, si probabil nu va aparea in valul al al vreunui pattern.
8. Traseaza linii de trend pentru a vedea pattern correct, linia tipica de trend b-d trebuie angajata, cu linii de trend opuse intotdeauna traseaza peste valul a si c.
avem in poza patternul si valul e in evolutie, daca nu sparge linia de trend a zigzagului pentru reversal si o retragere aproape de inceputul valului -e- ceea ce ma indoiesc, el va evolua pe un dublu zigzag sau dubla combinatie, ratia fibo o avem la 1495 e unu nivel foarte puternic si acolo intalnim e=161%a.
@am vazut azi un user -bigflames nu sunt eu!!!
))-
1
-
-
http://www.ew-forecast.com/newsletter/#elliott_wave_video_eurusd_audusd_and_oil sa vedem si diferentele intre teorii puteti sa faceti comparatie cu topicul NEOWAVES. o sa postez si aici analize calsice de la cativa traderi.
-
2
-
-
Question:
Since Mastering Elliott Wave, have you developed new ways of applying TIME to categorize corrections?
Answer:
In Mastering Elliott Wave (MEW) I cover general TIME relationships as they apply to impulsions and corrections, but a more sophisticated perspective has emerged since I wrote MEW nearly 20 years ago. Below is a description of how TIME behaves in Flats, Zigzags, Triangles, Diametrics, Symmetricals and Impulsions.
FLATS and ZIGZAGS (3 segment patterns)
1. The time differences between waves in Flats and Zigzags is greater than in any other correction.
2. If waves-a and b are about equal in time, wave-c will usually equal a+b in time.
3. If wave-b is much larger than wave-a in time, wave-c will equal the time of (a+b)/2.
4. Wave-b can NEVER take less time than wave-a in a Flat or Zigzag.
5. Based on the above, this means wave-c always takes more time than wave-a in Flats and Zigzags.
6. Over all other corrections, Zigzags allow for the greatest price differences between waves.
TRIANGLES (5 segment patterns)
1. Time differences between waves in a Triangle continue to be measurable, but are less obvious than what is seen in Flats and Zigzags.
2. If waves-a and b are about equal in time, wave-c will equal a+b in time.
3. If wave-b is much larger than wave-a in time, wave-c will equal the time of (a+b)/2.
4. Wave-b is allowed to take less time than wave-a IF it is smaller than wave-a in price. If it does, it almost always means the Triangle will possess what I call NEoWave Reverse Alternation (read about this in the Question of the Week section by doing a search for "Reverse Alternation").
5. Based on the above, this means wave-c always takes more time than wave-a in Flats and Zigzags.
DIAMETRICS (7 segment patterns)
1. These patterns began to appear in the early 90's as the market's way to adjust to the increasing popularity of wave theory (too many people were looking for the same things, so the market created new ways of behaving).
2. They were the first patterns I witnessed where most wave segments took about the same amount of time, with one or two of the waves consuming a little more (or little less) time than the others.
3. While most waves consume a similar amount of time, they do NOT consume a similar amount of price. A Diametric will possess an obvious expansionary or contractionary bias during the first four waves of the pattern; that bias will reverse during the second half of the formation.
SYMMETRICALS (9 segment patterns)
1. This pattern emerged around 2001 as the S&P went through its transition from a bull to bear market for the first time in more than a decade.
2. Their unique characteristic is that most of their waves consume about the same amount of time and price. Two of the waves may consume a little more (or a little less) time than the others and two of the waves (possibly the same two) will consume a little more (or a little less) price than the others.
3. Of all patterns, Symmetricals all for the least price and time differences between waves.
What we can derive from the above list, which is a NEoWave discovery, is that 3-segment corrections allow for the greatest time differences. As you move through 5, 7 and 9 segment formations, the allowed price and time differences continue to diminish with Symmetricals allowing for the least price and time differences between waves.
-
1
-
-
@vaxx, e greu chf foarte greu, nici o secventa din cadere nu e impulsiva. ai un diametric cu posibila extensie pe simetric, adica ai 7 segmente corective cu posibilitate de 9, complicat nu?
De ce nu e impulsiv; structura are incorporata doua tringhiunghiuri, cei cu analiza clasiaca vor nota ABCXABC 7 valuri; dar valurile D si F sunt triunghiuri, deci nu poate fi nici macar o dubla combinatie sau dublu flat sau zigzag, lipseste valul extins ipulsivitatea, lipseste alternanta intre D si F sunt triunghiuri. Deci valurile X(D si F) chiar daca sunt corective trebuie sa alterneze-(unul daca e triunghi celalalt trebuie sa fie flat, zigzag, duble si triple ...)alternanta e un concept fundamental in analiza elliott de care cei clasici tin mai putin cont, daca primul val D presupus (X) este triunghi al doilea val in aceasi directie este tot triunghi (F) presupus X! deci in concluzie nu poate fi dubla combinatie, este imposibil.
ultimul segment nu poate fi impuls arata clar o expandare -triunghi expansiv. pana la o mai clara situatie eu zic ca nu e tranzactionabil pe termen mediu si lung. in plus daca patternul continua miscarile corective vom avea H in sus si I in jos pentru un simetric; Daca patternul este finalizat vom avea o retragere rapida peste valul (e). succes!
-
1
-
-
@ovidiu, "zigzag trunchiat care face o extensie frumoasa" ori e trunchiat ori e ('extensie') alungit. acolo pare sa fie unul alungit din cate vad la tine in poza -ma rog abia observ pretul....- "imi place ai un grafic clar vizibil, liber se pot vedea segmentele foarte limpede" dupa ce te hotarasti ce e acolo iti dau si raspunsul, no offence!
incepe de aici http://www.elliottwave.ro/ewpublic/Teoria%20Elliott%20Wave.pdf
-
cand eram mai mic si mai vulgar era o vorba prin cartier: o sa formulez traducerea in engleza: in the dick with the satellite, formularea academica a romglezei, cam asta e treaba si cu ZEUS al Olimpului, la e acolo sus lucrurile se vad altfel.
-
2
-
-
-
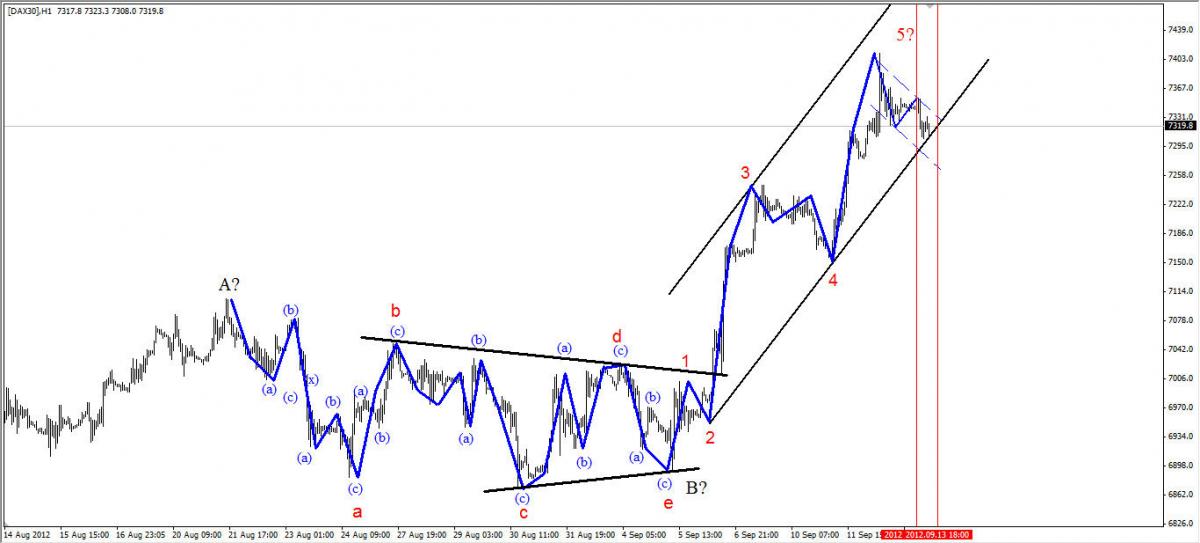
dax_ impuls terminal?
-
va dura ceva pe graficul de la gbp-usd, intr-adevar foarte dificil.
-
1
-
-
Ca sa nu mai amestecam (teoriile) propun ca deschidem un alt thread NEOWAVES & EWA ANALIZE SI TRADING, teoriile difera foarte mult, eu zic sa dam cezarului ce-i al cezarului. mare atentie teoria si metoda de aplicare neo valurilor nu este deloc usoara, ea nu se adreaseaza celor incepatori. Va multumesc!
-
2
-
-
ca sa nu mai amestecam (teoriile) propun ca deschidem un alt thread NEOWAVES & EWA ANALIZE SI TRADING, teoriile difera foarte mult in plus ca cei de aici initiaza si tranzactii, nu numai analize, eu zic sa dam cezarului ce-i al cezarului, am luat aceasta decizie din mai multe motive, grupurile de trading sunt vizibilie doar daca le accesezi, ele nu apar la deschiderea forumului (continutul lor). metoda neowave nu e chiar pentru incepatori daca si restu au inteles asta le multumesc.
-
1
-
-
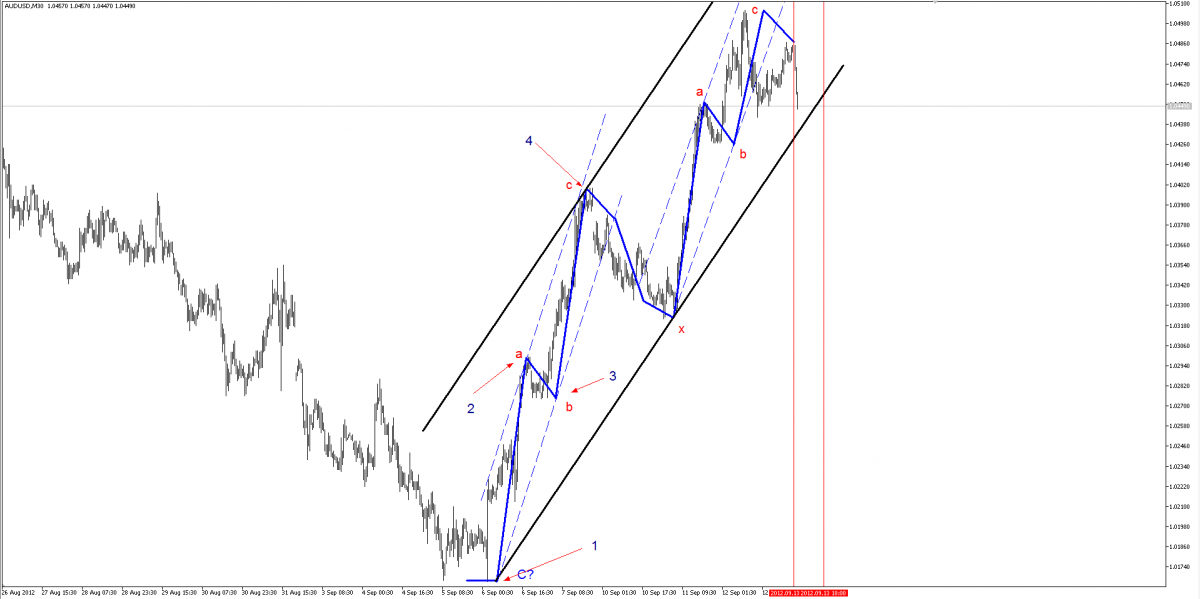
o prima confirmare la abc e ca ai patru puncte de atingere pe liniile paralele, atatea cat are si zigazgul si indica un formarea unui pattern non standard (x), la zigzagul simplu ai patru puncte ale patternului si numai trei ating liniile paralele, vezi cap 9
-
1
-
-
incercare de trasaj dax
-
@wolf-cineva e suparat rau tare. oare o fi prostia? stiu exact la cine ma refer!
-
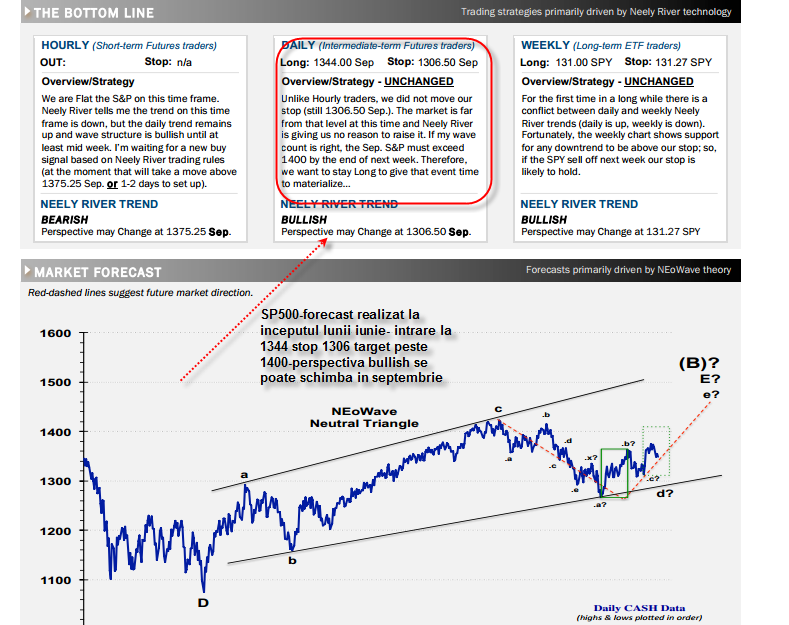
forecast realizat in 9 iulie, in text am scris 9 iunie.
am adaugat si un forecast din martie
-
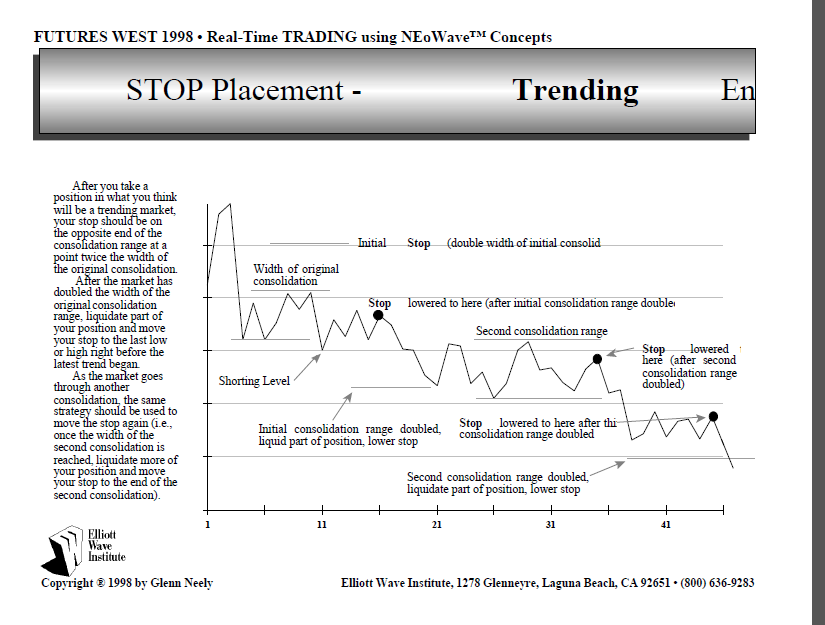
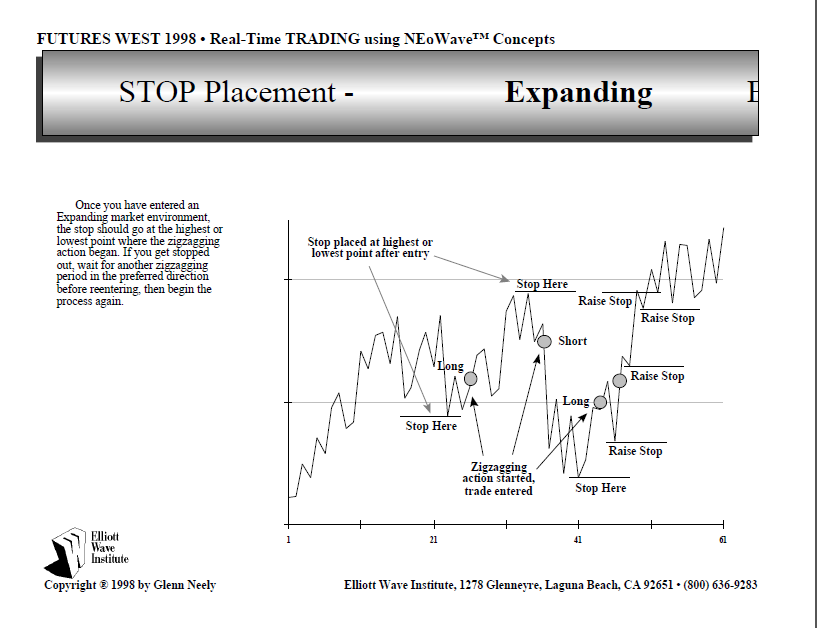
exemple de stagii de confirmare ale pretului; intrari -iesiri, confirmari, palsarea stopului si replasarea acestuia si forecast la sp500 facuta in 2004 vedeti evolutia din 2004 pana in prezent.
in poza 2 si 3 de la stanga la dreapta reprezinta insasi teoria trendului, asta e pentru ochi experimentati ....
=)) daca respecti minimal teoria trendului nu ai cum sa gresesti. -
@ZEN acum stiu, tu vrei sa sari etapele astea... vrei direct adrenalina -tranzactionarea- atunci ramai la scalp nu superi pe nimeni
)) -
nestiinta nu e un pacat, ignoranta da! trasarea segmentelor e o etapa in analiza, ZEN decat sa fii contrarian de ce nu citesti cartea ca sa te lamuresti, ai 12 capitole, te invata pas cu pas cum sa faci analiza si cum sa tranzactionezi, ce am vazut la Vaxx e abia primul pas.
-
1
-
-
@wolf -acu cativa ani era o gasca de "traderii" pe aici care au facut ceva valva.... in discutiile personale cu ei am aflat despre un lucru care m-a inspaimantat: credeau ca le vaneaza unii stopurile si banii se duc la o rasa de reptilieni, bilderbergi, trilateralisti sau masoni pur sange...sunt oameni in toata firea de aceea uluirea era foarte mare. De fapt nu gaseau alta vina pentru pierderile consecutive; o credinta cu un amestec de clipuri de pe youtube cu site-uri despre masoni reptilieni din domeniul financiar. Te apuca groaza in ce pot crede oamenii! Acum HTF a devenit noua scuza a impotentei!
De fapt nu au renuntat nici acum sa creada in aceste baliverne dar nici nu mai scriu pe forum.-
1
-
-
HTF nu e o drama, e doar pentru cine nu vrea!
)))))
 ) marirea si decaderea imperiului american-
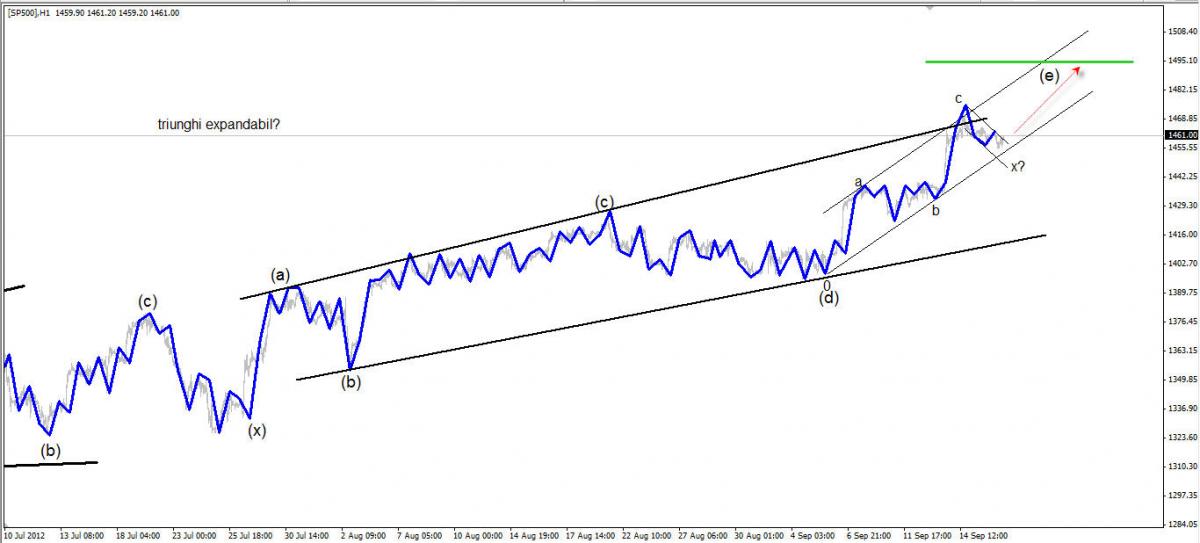

 =)) daca respecti minimal teoria trendului nu ai cum sa gresesti.
 De fapt nu au renuntat nici acum sa creada in aceste baliverne dar nici nu mai scriu pe forum.
- Anterioară
- 1
- 2
- 3
- 4
- 5
- 6
- 7
- 8
- 9
- Următoarea
- Pagina 4 din 16
Blogul zilei, analiza zilei.
în Forex pentru incepatori
Postat